
How does this affect the quality status?
Environmental concentrations of some radionuclides from the nuclear sector have decreased
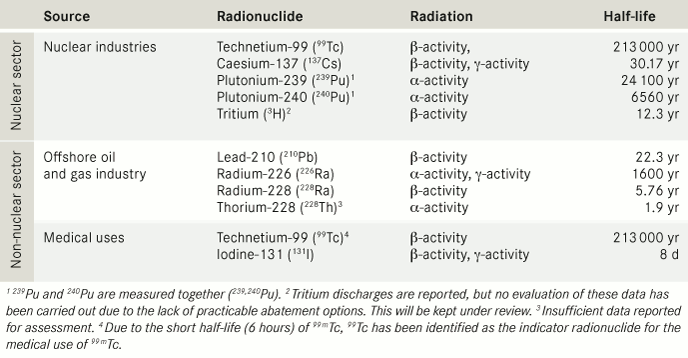
To assess progress towards the OSPAR objective on concentrations of radioactive substances in the marine environment, the OSPAR maritime area was sub-divided into 15 monitoring areas, taking into account ocean circulation, the location of nuclear sources and potential impact areas. For each of the 15 areas, where data were available, mean concentrations of the indicator radionuclides associated with discharges from the nuclear sector in seawater, seaweed, molluscs and fish in the period 2002–2006 Table 6.1 were compared with mean concentrations for the 1995–2001 baseline period Figure 6.5. Limited concentration data are available for the naturally occurring radionuclides identified by OSPAR as indicators for discharges from the offshore oil and gas industry Table 6.1 as well as for the α-emitting, naturally occurring radionuclide 210Po (half-life 138.4 days), which is an important contributor to the total dose received by man and marine organisms.
It was not always possible to compare the mean concentrations for the period 2002–2006 with the corresponding concentrations for the baseline period (1995–2001) or to undertake statistical analysis. This was due to a lack of data or because too many values were below the limits of detection Figure 6.5-A. In some cases, only one of the two statistical tests applied provided evidence for a significant change. Of the 24 cases where both statistical tests gave strong evidence for a change between the baseline period and the assessment period, the change was a reduction in every case but one (137Cs in fish in the Kattegat).
There are statistically significant falls relative to the baseline period in the mean concentration of 137Cs in seawater, seaweed, molluscs and fish in many of the monitoring areas in Regions II and III Figure 6.5-A. Statistically significant changes in indicator radionuclides other than 137Cs vary across the 15 monitoring areas, especially for seawater. The changes in mean concentrations of other radionuclides than 137Cs in seaweed, molluscs and fish are more consistent, with decreases relative to the baseline period in a number of monitoring areas in Regions II and III. This is particularly apparent in parts of the Channel (monitoring area 2) and the Irish Sea and Scottish waters (monitoring areas 4 and 7), due to the reductions in discharges from La Hague (France) and Sellafield (UK). The higher 99Tc discharges from Sellafield in the mid- to late 1990s are reflected in peaks of this radionuclide in seaweed (monitoring areas 4 and 7) Figure 6.5-B. However, some monitoring areas in Regions I and II still have elevated concentrations of radionuclides due to out-flowing Baltic Sea water contaminated with radionuclides from the 1986 Chernobyl accident Figure 6.6 or due to the remobilisation of radionuclides from Irish Sea sediments from past discharges and their transport by the prevailing ocean currents. Concentrations in monitoring areas in Region I mostly show no change because concentrations in water and biota are very low. Given the limited data for Region IV, few statistical changes can be determined. There are no monitoring data for Region V.
Elevated concentrations of naturally occurring radionuclides difficult to detect
Concentrations of naturally occurring radionuclides in seawater or marine organisms represent total environmental concentrations, i.e., both natural background concentrations and any contributions from the offshore oil and gas industry. OSPAR has not assessed trends in concentrations of naturally occurring radionuclides associated with discharges from the offshore oil and gas industry due to the limited amount of data available. As concentrations of these radionuclides from natural sources vary considerably within the OSPAR area, it is difficult to detect elevated levels originating from offshore oil and gas activities. Further work is needed to improve data availability and to assess the significance of naturally occurring radionuclides being discharged from the offshore oil and gas industry.
Doses to man are well below internationally accepted dose limits
Doses to man from seafood consumption have been calculated in two ways, either from reported levels of radionuclides in seafood or by modelling the possible uptake by seafood of radionuclides measured in seawater. The estimated doses to man from radionuclides associated with the nuclear sector cover a wide range of values Table 6.2, but are well below the current international dose limit of 1000 µSv/yr set by the IAEA and EU for members of the public arising from all practices involving radioactive materials. 137Cs and 239,240Pu represent most of the total dose arising from discharges from the nuclear sector. In comparison, doses from naturally occurring radionuclides (e.g. 210Po) can be up to one thousand times higher than those arising from 137Cs and 239,240Pu. Doses calculated for the naturally occurring radionuclides include the natural background concentration and should not be taken as coming entirely from the oil and gas industry.
Impacts on biota are unlikely
OSPAR has considered knowledge available on the impact of environmental radioactivity on marine life and its application to the OSPAR area. An EU project has recently proposed a method – ERICA (Environmental Risk from Ionising Contaminants: Assessment and management) – to assess and manage environmental risk from radioactive substances. The ERICA environmental risk assessment methodology sets a screening value of 10 µGy/h to characterise the potential risk to the structure and function of marine ecosystems. This is the lowest level at which effects at the ecosystem level are likely to occur according to current scientific understanding. According to the data available, calculated dose rates to marine biota are below this screening value. In the OSPAR area, the highest dose rates to biota occur in the Irish Sea near Sellafield (monitoring area 6). Monitoring areas 9 to 15 have the lowest dose rates Figure 6.7.
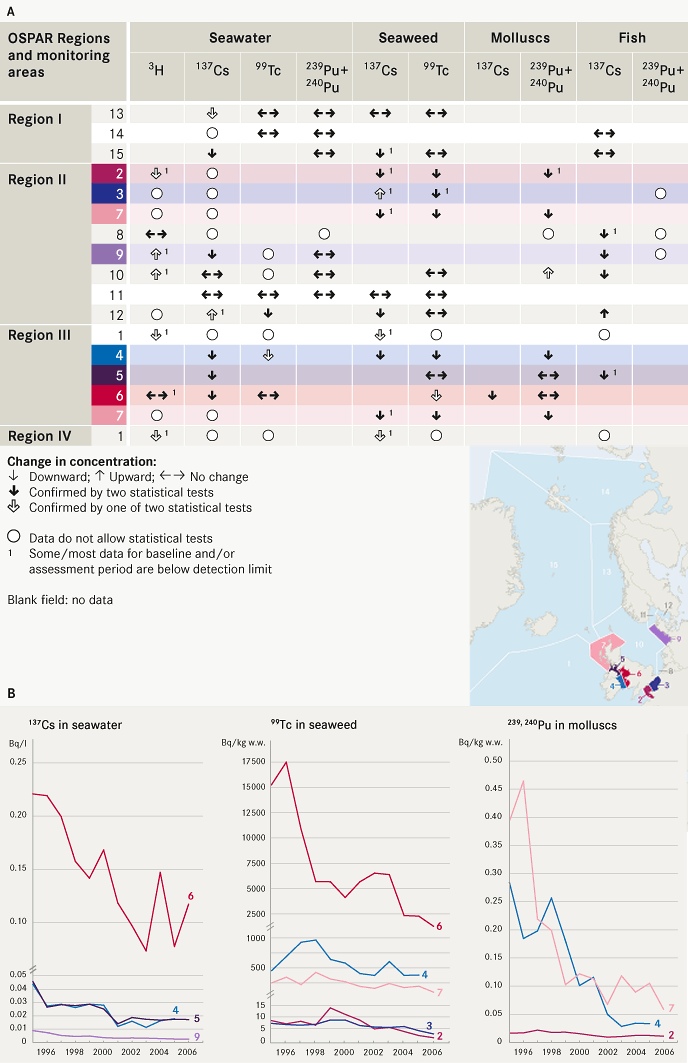
Figure 6.5 A: Summary of statistical tests...
PDF

Figure 6.6 Distribution of 137Cs concentrations...

Figure 6.7 Maximum total dose rates to seaweed, crab and plaice...