Did it work?
The 50% reduction target has mostly been met for phosphorus but not for nitrogen
Nutrient discharges and losses to water from point and diffuse sources to eutrophication problem areas have steadily decreased in Regions II and III over the past 20 to 25 years
Figure 4.2. By 1995, the initial timeframe agreed, most Region II countries had achieved a reduction of 50% in phosphorus discharges compared to 1985. This was not the case for nitrogen and OSPAR countries committed themselves to the 50% reduction target beyond 1995. Continued efforts have now resulted in further substantial decreases in phosphorus discharges in several countries of up to 85% compared to 1985. By 2005, some progress had also been made on reducing nitrogen discharges and losses to the North Sea, with Denmark having achieved the 50% reduction target and Germany and the Netherlands approaching it. More efforts are needed by OSPAR countries, especially to reduce nitrogen inputs to areas where eutrophication problems still exist. Differential reductions in nitrogen and phosphorus inputs can alter nitrogen/phosphorus ratios in seawater and this may cause shifts in algal species composition, for example from diatoms to flagellates.
Point source discharges are falling, but sewage is still a problem
Four countries have reported reductions in nitrogen and phosphorus discharges to eutrophication problem areas from industry of more than 80% for the period 1985–2005, with Germany (nitrogen and phosphorus) and the Netherlands (phosphorus) reporting reductions of more than 90%. Urban waste water is another major source of nutrient discharge and efforts to collect and treat waste water from households and industry are continuing. Most households in OSPAR countries are now connected to waste water treatment plants and many of these use biological and chemical treatment to remove nitrogen and phosphorus. Nevertheless, sewage effluents are still the main source of phosphorus to the marine environment and contribute a quarter of all nitrogen discharged to problem areas in Regions II and III Figure 4.3. Full implementation of the EU Urban Waste Water Treatment Directive is key to achieving further reductions.
Nitrogen losses from agriculture must be tackled
Nearly two-thirds of the nitrogen and a third of the phosphorus discharged to eutrophication problem areas in Regions II and III in 2005 came from agricultural sources Figure 4.3. The progress made since 1985 in reducing losses from agriculture varies between OSPAR countries and is more marked for phosphorus. Some countries have reduced nitrogen losses by roughly a quarter, while others have reported only minor progress or even small increases. While it is difficult to predict the future trend in fertiliser use and associated nitrogen releases from agriculture, the expansion in biofuel production to meet EU targets for renewable energy and the expected intensification of food crop production should be kept under review with regard to possible impacts on the eutrophication status of coastal areas. The reform of the Common Agricultural Policy provides an opportunity to promote agro-ecological schemes aimed at reducing nutrient losses to surface water. To reduce agricultural inputs to eutrophication problem areas it is essential for countries to fully implement the reduction measures under the EU Nitrates Directive, taking into account marine eutrophication, and the EU Water Framework Directive. OSPAR should assess, through modelling and in cooperation with the EU, whether these measures are sufficient to support the achievement of non-problem area status.
Trends in riverine and direct inputs are mostly downward
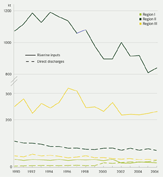
Rivers collect the nutrients discharged and lost from all land-based point and diffuse sources in the catchment and account for most of the waterborne inputs of nitrogen and phosphorus to Regions II, III and IV. Monitoring shows that nitrogen inputs from rivers and direct discharges to the sea have decreased to varying degrees since 1990 Figure 4.4. Phosphorus inputs show similar regional patterns, although reductions are generally more pronounced than for nitrogen.
Large decreases in the nitrogen loads carried by the rivers Elbe and Rhine and the phosphorus loads carried by the rivers Seine, Elbe, Rhine and Meuse underlie the clear fall in river inputs to Region II since 1990. Direct discharges of phosphorus for this period were significantly reduced but discharges of nitrogen were not.
There is no clear trend for river inputs to Regions III and IV in the period 1990–2006, but there has been a significant downward trend in direct discharges for Region III, reaching 50% for phosphorus. In Region I, total nutrient loads are small compared to the other Regions and remained unchanged in the period 2000–2006 because increasing discharges from mariculture offset reductions in riverine inputs.
Reductions in nitrogen emissions to air are limited and atmospheric inputs remain high
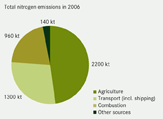
More than 4600 kt of nitrogen were emitted to air across the OSPAR Convention area as a whole in 2006, with combustion in power plants, industry and industrial processes, agriculture and transport, including international shipping, the main contributing sectors Figure 4.5. While emissions of oxidised nitrogen decreased by 20% in the period 1998–2006, mainly as a result of pollution control in industry and stricter emission standards for motor vehicles, emissions of reduced nitrogen, which are almost entirely attributable to agriculture, decreased only by 10%. Agriculture and combustion are estimated to have contributed most to atmospheric nitrogen deposition in the OSPAR area in 2006 Table 4.2. Nitrogen emissions from growing international ship traffic on the North Sea and the Atlantic have increased by more than 20% since 1998, to 560 kt in 2006, and accounted for 10% of total atmospheric nitrogen deposition to the OSPAR area.
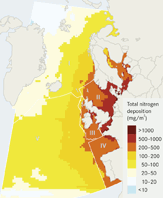
Models estimate that Region II receives most atmospheric nitrogen, as would be expected from the high levels of industry and agriculture in its coastal areas and its intense ship traffic Figure 4.6. Models show no significant trends in atmospheric inputs between 1998 and 2006 in the OSPAR area. This is supported by coastal observations of nitrogen in precipitation in Region II which show little change in this period. Monitoring also shows an increase in ammonium and nitrate concentrations in air in Regions I and II and nitrate in rain in Region IV. Efforts are required to reduce emissions from agriculture, combustion processes and transport, and to tackle emissions from increasing levels of ship traffic.


