Oil discharges have been reduced
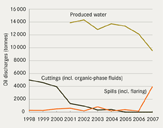
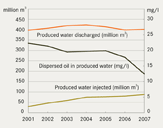
Produced water has been the major source of oil discharges from the offshore oil and gas industry over recent years, with the small remainder mostly from accidental oil spills Figure 7.4. Although the overall volume of produced water generated has increased with the increasing age of the fields, the amount of produced water discharged has remained reasonably constant since 2000 as more produced water is injected into sub-surface formations. Most countries have met and partly exceeded the OSPAR target of a 15% reduction in the total amount of oil in produced water, leading to an overall decrease of more than 20% in the OSPAR area between 2000 and 2006 Figure 7.5. This has been achieved through injection of produced water and the considerable efforts of the offshore industry to optimise processes and introduce new water treatment technology.
Most oil spills are small
Accidental oil spills arise from several sources, including pipelines, valves and broken hoses, and during offloading and filling of tanks. More than 95% of all spills are less than one tonne in volume Table 7.3. As infrastructure ages, the risk of accidents (e.g. leakage from older pipelines) may increase, resulting in more spills of oil and chemicals in future.
The frequency of small oil spills has progressively declined since 2000 while the number of larger spills has remained relatively stable. The volume of oil spilled varies widely from year to year. In 2006, around 170 tonnes of oil were spilled, whereas almost 4000 tonnes were spilled in 2007. The total for 2007 is dominated by a single large oil spill off Norway in which the amount of oil spilled was almost as much as the total discharged in produced and displacement water for the whole OSPAR area in 2007. The time and place of a spill are important; a relatively small spill can have a greater impact for example during the spawning season than a much larger spill at a different time.
Discharges of contaminated cuttings have largely stopped
Cuttings from wells drilled with water-based drilling fluids are discharged to sea in most OSPAR areas, whereas cuttings from wells drilled with organic-phase drilling fluids (which are still used in lower sections of wells) are re-injected into sub-surface formations in line with OSPAR measures or transported onshore for treatment and disposal. Discharges of drill cuttings contaminated with oil and organic-phase drilling fluids largely ceased in 2005. Cuttings contaminated by oil at levels below 1% can still be discharged to sea. Technologies which can clean cuttings to below 1% oil are now available for offshore facilities. Recent assessments of the potential for pollution from old cuttings piles through leaching or as a result of disturbance (e.g. decommissioning, trawling, dredging) indicate no significant impacts and that their management could be addressed by OSPAR countries as part of the decommissioning plan for the installation.
Discharges of priority chemicals are 90% lower than in 2003
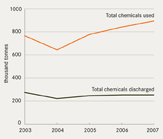
Comprehensive data on the use and discharge of chemicals are only available for 2003 onward. Since then, the amount of chemicals used offshore has increased, but there has been a slight decrease in the amount discharged Figure 7.6.
Around 900 000 tonnes of chemicals were used offshore in 2007 of which 250 000 tonnes were discharged to sea. Most substances used and discharged offshore pose little or no risk (PLONOR) to the marine environment; in 2007 almost 87% of chemicals discharged were PLONOR substances. This includes substances such as barite (barium sulphate) used in large volumes as a weighting agent in water-based drilling muds, methanol used as gas hydrate inhibitor or potassium chloride used in brine solutions in drilling and completion of wells. About 2500 tonnes of the chemicals discharged in 2007 were substances identified by OSPAR for priority action or substances that should be substituted by less hazardous substances. Discharges of substances identified by OSPAR for priority action have been reduced by around 90% since 2003. This is mostly due to their substitution by less hazardous alternatives. Also, concentrations of naturally occurring heavy metals in produced water are generally low.
Most offshore structures are brought ashore for disposal
Since the ban on dumping of, or leaving in place, disused offshore installations in 1999, 122 offshore installations have been brought ashore for disposal. In this period, permits have been issued for four concrete sub-structures and the footings of one large steel structure being left in place. The decommissioning of the Frigg field is one example. Derogations from the dumping ban may be considered for 59 steel installations with a sub-structure of more than 10 000 tonnes, and 22 gravity-based concrete installations.

